 If you want to maximize the tool, Google Analytics gets pretty complex pretty quickly. But that shouldn’t stop you if you’re just starting to pick up new skills. Mercifully, within the bounds of Google Analytics, people can share how they filter information, how they run reports, how they use dashboards – if you’re new to GA, this can take you from 0 to 30, so to speak, fairly quickly.
Your first 60 minutes should be spent getting familiar with a few areas and concepts, as well as downloading some useful segments and reports from more seasoned users.
Getting Familiar with Standard Reports
Take 20 minutes to get familiar with the most useful default Google Analytics reports. The GA left nav is neatly divided into visitors you acquire, how they behave, and how many of them convert. Keep in mind that you’ll want to progress pretty quickly from standard reports – you’ll want to use Advanced Segments pretty soon, at the very least.
Still it pays to know where the basics are – and the most common ones you’ll want to use are under behavior and acquisition.
1. Behavior> Site Content > All Pages
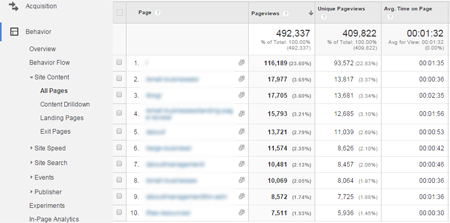
This is where you’ll spend most of your time in the beginning – viewing pages, page views, and bounce rate. Two core traffic stats are usually used as a stand-in for how much traffic the site is getting – page views is one, and sessions or visits is the other. Bounce rate is usually the main metric reviewed for engagement. This report is useful if you want to check general trends, or if you want to search for a particular page from some campaign you are running to check for traffic.
2. Acquisition> All Traffic> Channels
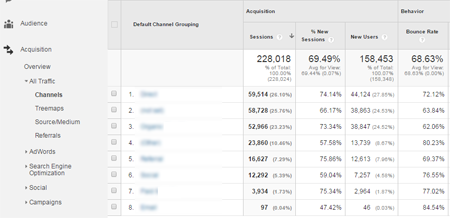
Without customization, this report allows you to spot-check all your core sources of traffic, like other sites (known here as “Referrals”) or unpaid search engine traffic. (“Organic Search”) If any of your channels have drastically high bounce rate, it may be time to drill down deeper on that front.
3. Audience> Technology> Browser & OS
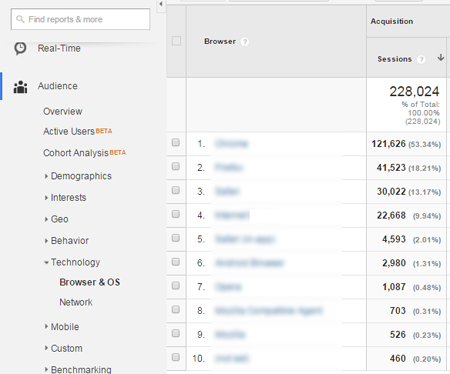
From here, you’ll see which browsers are getting used to access your site. This is especially helpful if you know certain features aren’t working on a particular browser, like certain javascript and CSS behaviors on Internet Explorer.
When you use Google Analytics standard reports, you view data for everything. That’s typically not as helpful as viewing a particular segment that you’re particularly interested in. Once you’re familiar with where the main reports are, it’s time to filter the data.
Getting Familiar with Advanced Segments
Let’s talk about the next 20 minutes.
Let’s go back to the Behavior> Site Content> All Pages. Let’s say that instead of all the traffic, you want to see just the mobile traffic. What you want to do is filter down to that – and what you’d use is an Advanced Segment.
To activate that, where you have All Sessions, click on the current segment, and that will open up the segment selection.
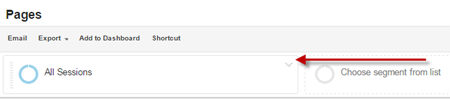
From there, you can select a segment, in this case Mobile Traffic.
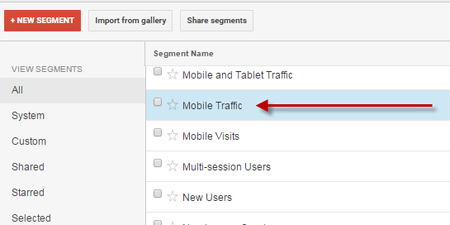
That will get you just the mobile visitors.
The other great thing about segments is that they can be stored and shared. There are some very good references to get great segments – you have the giants like Avinash Kaushik or Justin Cutroni, or you have select articles from this blog talking about useful segments.
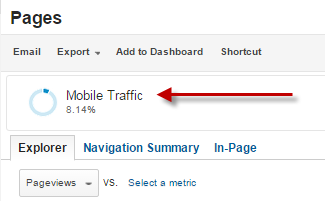
To make sure you have your segment applied, you should check the space where “All Sessions” used to be, and make sure your segment has been applied.
BONUS: After you apply your segment, Google will use some techniques to save them some computing power. Make sure you minimize that, and keep your data as accurate as possible, by tweaking the configuration bar at the upper right.
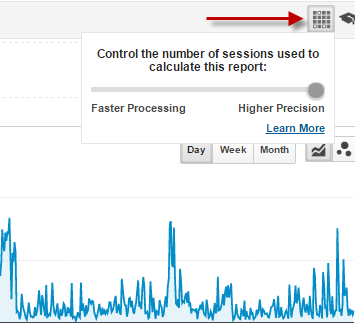
Set the bar to “Higher Precision,” and you should be good to go.
Importing Custom Reports and Advanced Segments
The next 20 minutes, you can use to familiarize yourself with importing. It works pretty much the same way for segments and reports.
The thing about learning GA is that the Google Analytics community makes it incredibly easy to get existing reports and segments from other people, reducing the steepness of the learning curve. So, say you want to use a feature like Weighted Sort, something you can use to look at the pages with the most traffic and the highest bounce rates.
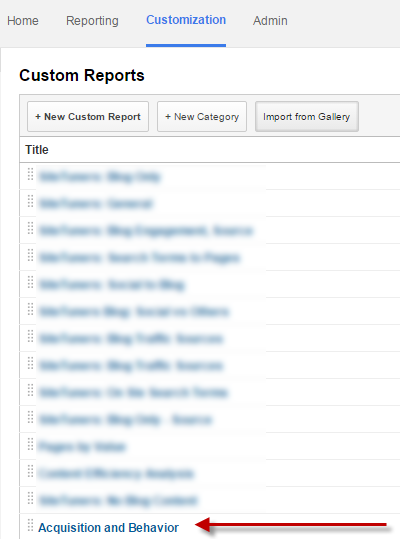
Now, say the custom report you need has already been made – Google Analytics allows you to import Custom Reports on the fly. In this case, you would need the Acquisition and Behavior report we created some time back. You can start the import by having Google Analytics open, and clicking on this link.
Once you do, you should see a screen like this:
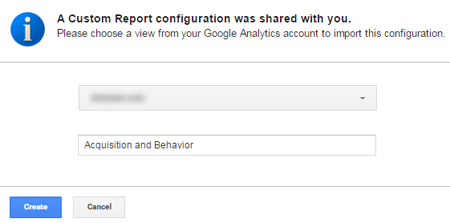
Select the profile you want to use the custom report for, then select “Create.”
And that’s it – you have imported a Custom Report. Easy, right?
The next time you go to Customization at the top navigation, the report you just imported should be there.
BONUS: If you’re trying to import that particular report to get weighted sort working (something we have talked about in the past), make sure you have no Advanced Segment applied, just the custom report. Then you can just sort by bounce rate, and then select Weighted Sort:
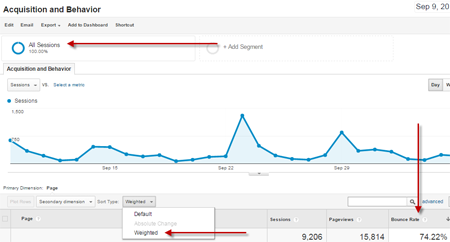
To use things like Weighted Sort to find the pages you need to fix, just make sure you go back to the segment “All Sessions” to ensure no Advanced Segment is being applied, then click on bounce rate to sort by Bounce Rate.
Shortening the Learning Curve
Google has invested a ton of effort into making Google Analytics easier to learn, but it helps to start somewhere. If you’re new to the software, it pays to make sure your first hour is spent learning where the most useful reports are, applying segments to filter data, and importing segments and reports from people who have been using the tool a while.